We think of the earth as solid. Quiet. Stable.
It is none of those things when the Sun screams.
Scientists have finished an eighteen-year project mapping the electrical resistance under North America. They did this because we have a problem. If a solar storm like the one in 1989 hit today? We would be in trouble.
Mapping the Invisible
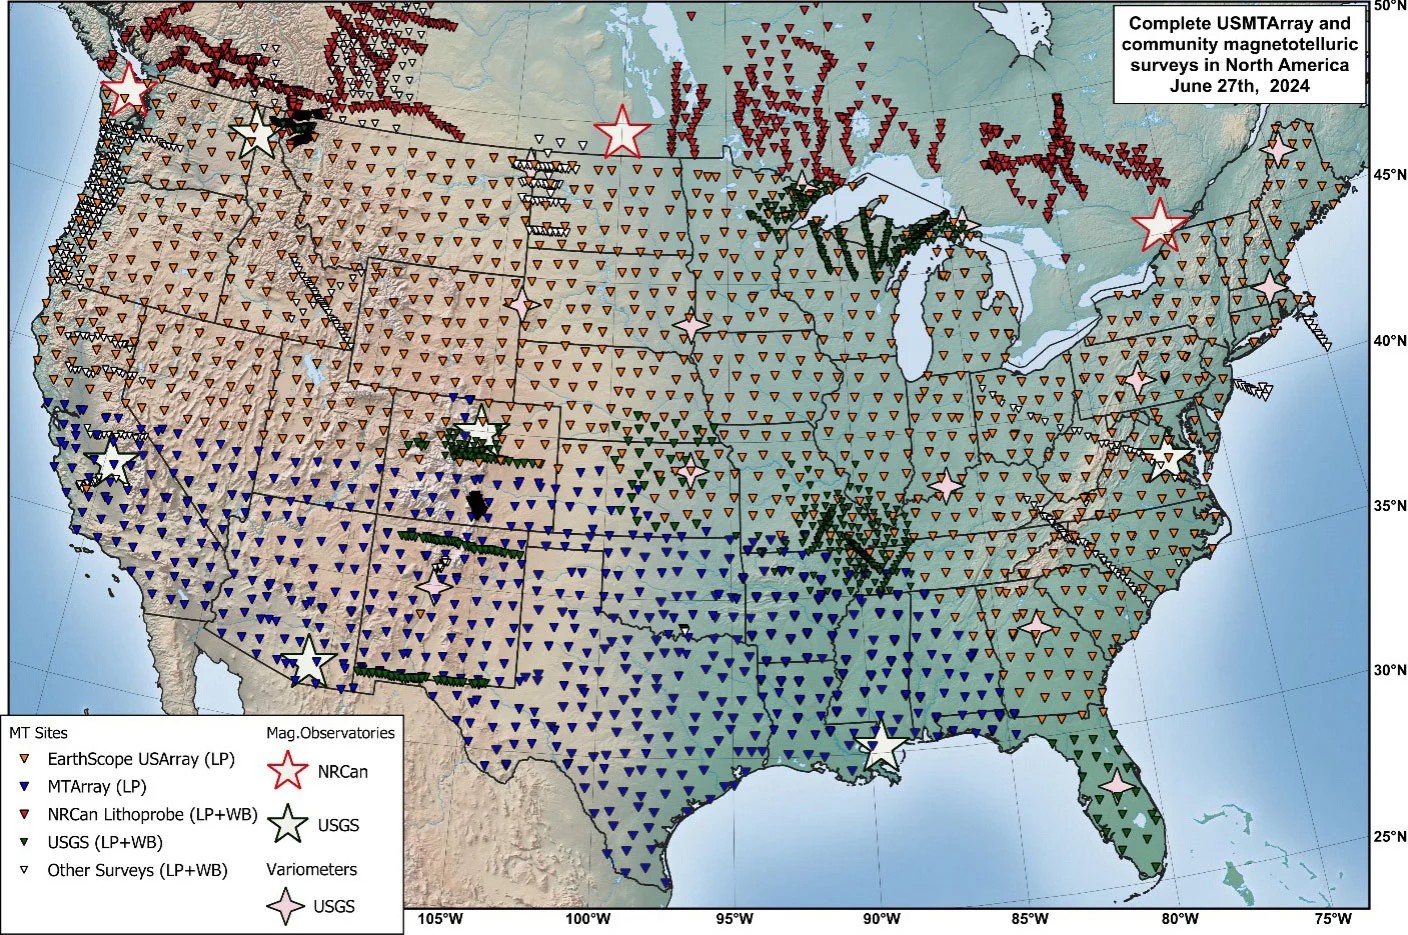
The United States Magnetotalluric Array (USMTARRAY) finally released its data. After measuring fluctuations at more than 1800 locations across the country, researchers from Harvard and Smithsonian built the first detailed 3D map of how electricity moves underground.
It is not just dirt.
It is fluid, minerals, heat, and ancient rock.
“Magnetotelluric… responds very strongly to things like fluids,” said lead author Anna Kelbert. “It gives us a fundamentally different window compared to seismic data.”
This map goes down to the mantle. It shows where currents go when the sky goes dark.
The 22 Volt Problem
In 1989, a solar storm blacked out Québec for nine hours. It was bad. But the ground under the eastern U.S. conducts electricity differently than Canada. Worse for the grid, specifically.
Kelbert’s team looked at data from that same 1989 storm. At one site in Maine the geoelectric field hit 22.79 volts per kilometer.
To put that in perspective: power grids hate direct current (DC). They are built for alternating current (AC).
Anything over 1 V/km makes the grid industry nervous.
Twelve times that limit? That is dangerous.
If you run those voltages along a 200 km power line you get 4,000 volts driving DC through your equipment. Transformers overheat. They melt. They are expensive. They take months to replace.
And during that time? You have no light.
It Gets Worse
Here is the twist.
We used to think the earth’s electrical resistance changed smoothly. A nice gradient. One thing leading to another.
The new map proves we were wrong.
Geoelectric risk changes wildly over just a few miles.
A power plant here is safe; one five miles away is in the blast zone.
Currently, this data feeds real-time alerts for NOAA and the USGS. It helps emergency managers know which parts of the country are about to cook their transformers. It is a massive improvement over the old 1D models. But it is reactive.
Ancient Bones and Future Failures
The survey also found things unrelated to solar storms. Like a billion-year-old geological puzzle.
They can see old landmasses crashing together. Subduction zones buried deep underground. Graphite. Sulfide minerals.
It is a map of how North America got here. And yes? It might help find new mineral deposits.
But the immediate worry is the Sun.
“There is still a gap,” Kelbert notes. Between knowing the fields exist and making operational decisions in time to shut down a grid.
Prediction.
That is the goal. Right now, we can detect the incoming surge. We can map where the electricity wants to go.
Can we stop it in time?
The ground is conductive. The Sun is active.
And the wires are waiting.